Auto-Detecting Anomalies in Your Key Metrics
As your web application grows, so does the importance of monitoring. With more cogs in the machine, more things can go wrong. At Yipit, we want to find and fix application level errors in a timely fashion.
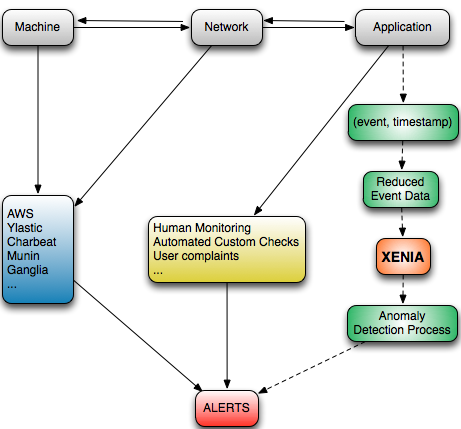
While our test suite catches most bugs, some inevitably seep through. Whereas many tools such as Ylastic, AWS, Chartbeat, Munin, and Ganglia help mitigate the monitoring headache on the machine and network level, they don’t do as great a job at the application level.
Monitoring of Application Level Metrics at Yipit
At Yipit, our application metrics consist mostly of user actions, or events. We log everything from opening our daily email and browsing the web interface to making an API call and using our mobile app.
Up until now, we’ve relied on human monitoring, user complaints, and automated custom scripts to detect worrisome trends in our application metrics. However, our recent growth forced us to look into more scalable solutions to this problem. As such, we have begun developing an automated anomaly detection system for monitoring application level metrics more intelligently, code-named Xenia.

Xenia (Not the Warrior Princess)
The main purpose of Xenia is to alert us as soon as some event metric starts to behave abnormally, as this could be indicative of an error. On the flip side, if some metric like sign-ups is doing much better than normal, we can relate it to an exogenous event such as a favorable newspaper article. As such, Xenia is useful not only for diagnosing errors, but also for understanding what you are doing right.
Anomaly Detection as a Classification Problem
To express our problem formulation in more theoretical terms, consider a classification problem where some time series data is either normal or abnormal. All Xenia is doing is classifying incoming data into one of these two cases. Naturally, the definition of normal is key here.
At Yipit, we approached this by leveraging historical data and applying statistical analysis.
A baseline process is performed on normal historical data, aggregated over several periods. In sampling a fresh period, Xenia looks at how much the fresh data differs from the baseline data.

Pictorially, you can think of the historical data as dots in some vector space. Xenia draws a tolerance boundary around it, and determines whether fresh data points fall within that boundary or not. Note that this is different from clustering - clustering means grouping objects into different classes whereas classification means determining which class a new object belongs to.
Comparison Methodology
In comparing the data, we do not use frequencies (e.g. number of API calls per minute), but rather slopes (e.g. the increase of API calls since the last minute). By using slopes instead of raw values, we avoid anomaly detection based on mere growth. Instead, anomalies are defined as radical changes in the slope profile of a certain metric.
Since slopes can take on any value, we bucket slopes into power buckets. This means that any slope x, where 2i <= x < 2i+1, would fall into bucket i. This way, buckets are less granular at extreme slopes, to help accommodate a huge range of slopes into a finite number of buckets. The number of times each bucket is hit is used to profile a metric.
Detecting Anomaly
Now, there are many ways in which the slope profile of a certain metric can differ from its historical profile. It can hit previously empty buckets, hit a certain bucket a different number of times, result in different values when performing statistical tests, etc. To give you a concrete example of a statistical test we use, take the Mann-Whitney U Test, which yields a test statistic indicative of how likely two samples (the historical and the fresh data) are to come from the same probability distribution.
Each way in which fresh data differs from its historical profile constitutes an alert reason, and is assigned a score based on its type, magnitude, and weight. An anomaly is detected when the sum of these scores exceed a dynamic threshold determined by machine learning.

Breaking Down an Anomaly
These alert reasons allow us to understand the main contributing factors that triggered the alert, which Xenia could use to tweak parameters dynamically.
Furthermore, this breakdown allows for additive development in the sense that we can add new alert reasons as we come up them without replacing old ones. With machine learning, alert reasons can also be toggled and assigned different base weights based on their effectiveness.
Visualizing Anomaly
Whenever an anomaly is detected, Xenia displays relevant statistics and information, as well as graphs to visualize the data (using Graphite). Such an alert view also has a feedback capability, where humans, after looking into the issue, can mark the alert instance as true or false. This way, Xenia constantly learns and improves, and reacts dynamically to different types of metrics over time.
A Work in Progress
While we believe in its potential, our current methodology relies on some assumptions and has weaknesses:
Assumes independence of sequential slopes
Disregards order of slopes
Doesn’t take into account relationships between metrics
Calibration takes time
Impacted by seasonal factors (like holidays) unless historical data spans more than a year
But we see Xenia as an evolving project. Soon, we hope it will be good enough to serve Yipit’s needs. We’ll be sharing our progress, mistakes and lessons learned as we continue to work on this project.
Meanwhile, we would really appreciate suggestions and feedback. You can comment below or reach out to Henry Xie, the author of this project, at henry at yipit dot com.
Eventually, we hope it could become generic and good enough to constitute an important tool for any large web application.